


Kempton Pace Bias Statistics
The graphs below indicate what percentage of horses with a particular running style won, over each particular distance.
The three different styles are horses that led, horses which were mid pack, and horses held up at the back.
The Pace Indicator (PI) is a quick representation of the analysis, and indicates the style of running which is most favourable over each particular distance. A PI of 2 would indicate that all winners led. A PI score of 0 would mean that all winners were held up. Obviously the actual figure is always somewhere in between depending on the pace bias which exists.
| Distance | Analysis | PI |
| 5 Furlongs | 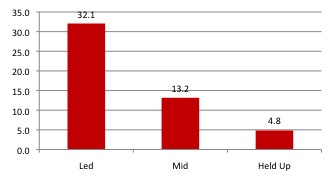 |
 1.54 1.54 |
| 6 Furlongs | 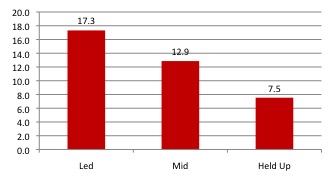 |
 1.26 1.26 |
| 7 Furlongs |  |
1.28 |
| 1 Mile |  |
1.20 |
| 10 Furlongs | 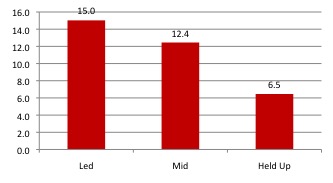 |
1.25 |
| 11 Furlongs | 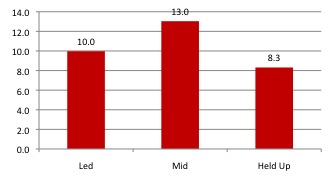 |
 1.05 1.05 |
| 12 Furlongs | 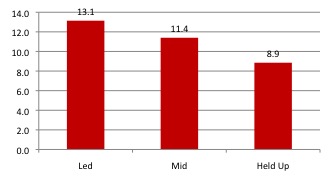 |
1.13 |
| 16 Furlongs | 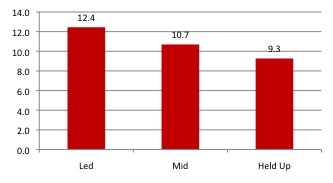 |
1.10 |
Although Kempton is obviously one course in affect it has a track within a track. As over 5 and 10 furlongs the inner loop is used, which means the course is a tight course with a short run in. So for these distances, particularly over 5 furlongs front runners are massively favoured.
However for the other distances which use the outer loop, the bias is completely reversed and it is very hard for front runners to hold on up the very long straight. Kempton has one of the most occurrences of horses losing having been matched at 1.10 or less.
In terms of the individual distances, if we look at were Kempton ranks against other all weather courses which have races over equivalent distances. Kempton is ranked very near the top for Front Runners for every distance
5 Furlongs 2nd out of 5 courses
6 Furlongs - 4th out of 5 courses
7 Furlongs 3rd out of 4 courses
8 Furlongs - 4th out of 5 courses