Southwell Bias Statistics
The graphs below indicate what percentage of horses with a particular running style won, over each particular distance.
The three different styles are horses that led, horses which were mid pack, and horses held up at the back.
The Pace Indicator (PI) is a quick representation of the analysis, and indicates the style of running which is most favourable over each particular distance. A PI of 2 would indicate that all winners led. A PI score of 0 would mean that all winners were held up. Obviously the actual figure is always somewhere in between depending on the pace bias which exists.
| Distance | Analysis | PI |
| 5 Furlongs | 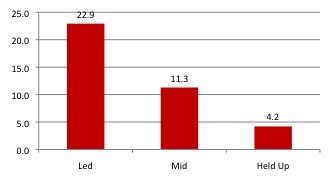 |
 1.49 1.49 |
| 6 Furlongs | 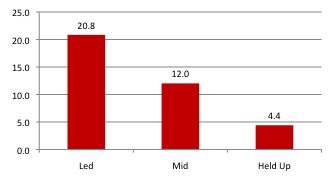 |
 1.44 1.44 |
| 7 Furlongs | 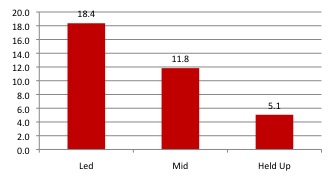 |
1.38 |
| 1 Mile |  |
 1.24 1.24 |
| 1 Mile 3 Furlongs | 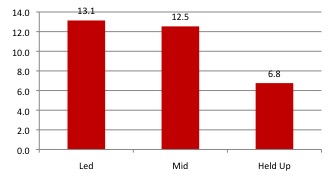 |
1.2 |
| 1 Mile 6 Furlongs | 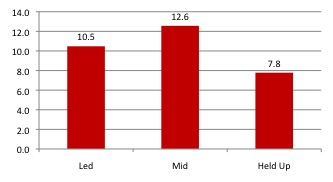 |
 1.09 1.09 |
All of these stats are from when Southwell had a fibresand surface. The surface is now the totally different Tapeta, so the stats above are no longer relevant.
In terms of the individual distances, how Southwell ranks is shown below:
5 Furlongs – 3rd out of 5 courses
6 Furlongs - 2nd out of 5 courses
7 Furlongs – 1st out of 4 courses
8 Furlongs – 2nd out of 5 courses
In terms of the individual distances, how Southwell ranks is shown below:
5 Furlongs – 3rd out of 5 courses
6 Furlongs - 2nd out of 5 courses
7 Furlongs – 1st out of 4 courses
8 Furlongs – 2nd out of 5 courses